Returns
Annual Historical Returns
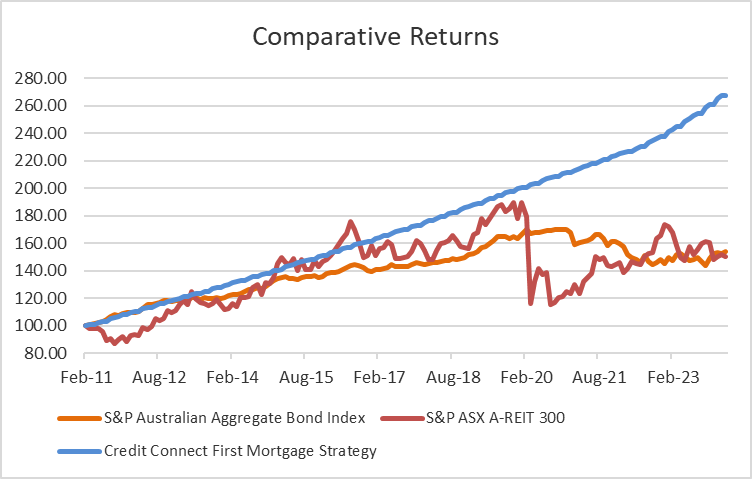
The annual returns have been calculated on a total return basis net of fees with all interest reinvested monthly with no allowance for tax. The same metrics have been applied to deliver total returns for the S&P Australian Aggregate Bond Index and the S&P ASX A-REIT 300 over the same period. The returns are compiled using historical returns of the mortgage fund, Credit Connect Seclect Fund and then syndicated loans to our clients prior to the fund launch. All returns are net investor returns based on the first mortgage methodology in effect. This prior historical performance reflects the application of our methodology through syndicated loans and the selection of those constituents with the benefit of hindsight and knowledge of factors that may have positively affected its performance, cannot account for all financial risk that may affect results and may be considered to reflect survivor/look-ahead bias. Actual returns may differ significantly from, and be lower than, historical returns. Past performance is not an indication or guarantee of future results.
ANNUAL HISTORICAL RETURNS
CREDIT CONNECT SELECT FUND & MORTGAGE SYNDICATION
2004 | 11.31% | 2014 | 9.11% |
2005 | 11.48% | 2015 | 9.33% |
| 2006 | 11.93% | 2016 | 12.40% |
| 2007 | 9.65% | 2017 | 11.02% |
| 2008 | 12.68% | 2018 | 9.16% |
| 2009 | 9.38% | 2019 | 8.30% |
2010 | 10.36% | 2020 | 8.91% |
2011 | 12.68% | 2021 | 9.35% |
2012 | 13.45% | 2022 | 9.40% |
2013 | 14.00% | 2023 | 8.30% |
Ready to Explore?
Contact us today to learn more about the Credit Connect Secure Income Fund or request a Product Disclosure Statement for the Fund and see how you can become a part of our investor community.